Business leaders have now accepted elevated outcomes come from the capability to produce and comprehend deep insights from data. These insights reveal trends and patterns that can drive informed decision-making and enable calibrated actions that positively influence the bottom line. Given the rising importance of business agility and resilience, organizations are actively looking at robust data visualization tools to identify opportunities for improvement or plug activities causing a dent in organizational outcomes.
Research shows that organizations that leverage business intelligence and data visualization can obtain critical information 78% of the time within the decision-making window. Be it evaluating and driving customer interactivity, analysing product performance, implementing focused and targeted campaigns, identifying potential risks, or navigating complex supplier/distributor networks; data visualization can do a lot of heavy lifting for organizations.
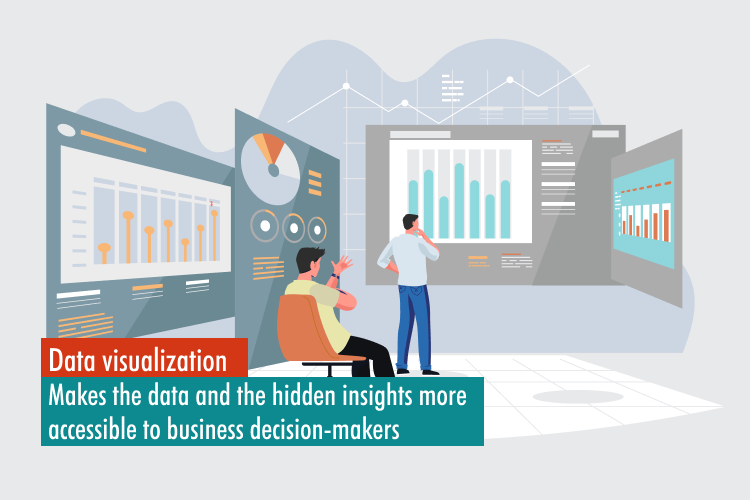
Data visualization gives a visual context to the data at hand, thus, making it easier to identify patterns and outliers within large data sets. It becomes an essential investment to find value in the big data investments that organizations make. Good data visualization tools change the way we work with data and deliver more immediate responses and allow us to respond more rapidly. A key benefit is that data visualization makes the data and the hidden insights more accessible to business decision-makers and presents it in a format that becomes easy to understand and act on. It also promotes creative data exploration and allows organizations to use and explore the data more creatively, differently, and imaginatively.
Data visualization needs good data
There are a plethora of great, not just good, data visualization tools available in the market that promise the land of gold to its buyers. While organizations understand the importance of data visualization, it’s hard to ignore the fact that these tools are a considerable investment. Organizations obviously want to see a high return on these investments. The capacity of the data visualization tool and the insights it delivers, however, is directly proportional to the quality of data that goes into it.
Needless to say, today we are swimming in oceans of data. With the connected economy, data is being generated in petabytes and zettabytes. As the volume of data increases exponentially, so does the demand for ‘good’ data. Because ‘good data’ is the data in the vast sea of data that is relevant to the business or the specific use case. Powerful visualization tools not only need large volumes of data, but they also need access to relevant, useful, and pertinent data. The good data.
Robust data collection and aggregation capabilities are essential to get RoI from expensive data visualization investments. Some of the current challenges in existing data collection practices can be highlighted as
Inconsistent data collection standards
Inconsistent data collection standards can impact the quality of data. For instance, a consumer brand that works with hundreds of distributors spread across nations and regions is at risk of getting widely differing quality of data from across the channel. Various distributors could collect, format, present, and share data differently, at different times, and reported differently. Data standards outline how data items should be collected and define the consistent data collection processes. Taking care of the national, state-level, and regulatory and compliance standards is essential to drive good data collection.
Applying these standards broadly and a coordinated effort to standardize data collection practices improves the quality of data collected by making sure that there is no variation between how the data is collected and recorded.
Connecting the right data sources
Given the growing volumes of data, data can only deliver value when it is comprehensive. For this, however, it is essential to connect all the data sources cohesively, comprehensively and capably leverage contextual data. After all, not all data is created equal in the data universe.
Making sure that the right data sources are connected and can capably aggregate the right data for the data virtualization tool to work appropriately and deliver deep and intelligent insights. Consumer brands, for example, will have to connect all the data sources that are relevant to the customer experience to gain a 360-degree view of the customer. If all the data sources, including across the distribution channel, are connected and the right points and all the relevant data are aggregated, then the data visualization tool can do its magic and deliver insights that can be used to create impactful customer experiences.
The inability to source the right data from the right and all the data points, simply won’t be able to deliver impactful outcomes because of its incompleteness.
The complexity of data and data aggregation challenges
Navigating the complexity of data and different kinds of data also becomes critical to make the most out of data visualization investments. Simplifying the data collection process, connecting the right data points, and simplifying the data in use can significantly influence the data visualization process.
That apart, simplifying data aggregation while ensuring the comprehensiveness of data is important for data visualization. Data aggregation, on the other hand, can become time-consuming and effort-intensive in the face of lacking experience and technology. Data cleansing becomes another beast to tackle to make sure that data virtualization efforts deliver great results.
Usually, data entry is done manually making it an effort-intensive and often error-prone methodology. Using comprehensive “technology + managed service” solutions that remove the need for redundant data entry and move the data entry to the point of origin using APIs and tools like Power BI. This approach saves time and effort that goes into data collection while improving the quality of data. Plugging in this high-quality data into visualization tools automatically generated intelligent, deeper, comprehensive, and correct insights that can be used to take the organization to greater heights. That’s how to ensure these powerful tools deliver the maximum bang for the considerable buck.